


Is Your Factory Losing Revenue Unknowingly? The 3 Invisible Gaps and 4 Pillars to Reclaim 15–30% Hidden Capacity
Hidden capacity is the 15–30% of production potential a factory already owns but cannot see, because micro-stops, speed losses and siloed data go unrecorded. Manufacturers reclaim it with four pillars: a unified SCADA + MES layer, real-time OEE tracking, automated data collection, and closed-loop ERP integration. Most plants operate at only 70–85% of their true potential.
Key takeaways
- Hidden capacity is the gap between what your equipment can do and what your systems actually capture.
- The loss is usually a visibility and data problem, not a hardware or workforce problem.
- Three invisible gaps hide it: the illusion of activity, the performance blind spot, and fragmented data.
- Four pillars recover it: unified SCADA + MES, real-time OEE, automated data collection, and ERP integration.
- Real ROI varies by organisation, because each business measures it differently, so we don’t quote a single percentage.
What is hidden capacity in manufacturing?
Hidden capacity is the difference between what your equipment is capable of and what your current systems are actually capturing. Most manufacturers unknowingly operate at only 70–85% of their true potential, meaning a 15–30% capacity loss that never appears on a report (Depending on the variable factor and system).
This loss is rarely caused by faulty machines or operators who aren’t working hard. It comes from a lack of visibility and data normalization: when performance is filtered through legacy reporting, the plant’s true capability is obscured by fragmented metrics and reactive firefighting.
OEE (Overall Equipment Effectiveness) = Availability × Performance × Quality. It is the standard measure of how much of your planned production time is truly productive, and the clearest way to expose hidden capacity.
What are the 3 invisible gaps that hide performance losses?
Walking the shopfloor (the “Gemba walk”) is not enough in a modern digital factory. A machine can look like it is running while micro-inefficiencies quietly erode output. Three systemic gaps keep these leaks undetected:
| Gap | What happens | Why it stays hidden |
|---|---|---|
| 1. The Illusion of Activity | Machines appear active, but output stays inconsistent. | Without automated tracking, the delta between “machine-on time” and “value-added production” is never measured. |
| 2. The Performance Blind Spot | Major breakdowns get attention; micro-stops and subtle speed losses do not. | These events are too brief to log manually, yet they compound across three shifts and destroy significant throughput. |
| 3. The Root Cause of Fragmentation | Data is trapped in silos across the plant. | Without cross-line analysis, you cannot tell whether a bottleneck is a specific machine, a material-flow issue, or shift-based variance. |
How much revenue does invisible downtime actually cost?
Reframe it: this is not a system problem, it is a profitability problem. Every minute of unrecorded downtime or suboptimal cycle time erodes gross margin directly. Operational invisibility creates four compounding costs:
- Hidden OEE losses: Untracked micro-stops and speed losses suppress throughput and cap revenue. You cannot sell capacity your planning team cannot see.
- Manual reporting overhead: Spreadsheet culture consumes thousands of engineer and supervisor hours each year reconciling paper logs.
- Delayed decisions: When data takes 8–24 hours to surface, it is historical, not actionable. Quality escapes and rework costs climb before anyone intervenes.
- Margin erosion: Inconsistent performance across lines and shifts makes precise cost control impossible.
Why do traditional SCADA and PLC setups still leave a visibility gap?
Traditional SCADA and PLC systems excel at machine-level control, but they were not built to deliver enterprise intelligence. Many plants have invested heavily in automation and still cannot see across the business. Legacy architectures fail for four reasons:
- Siloed data: Signals are trapped at the machine layer, visible to an operator but not the enterprise.
- Island departments: Each cell operates alone, so plant-wide bottlenecks stay invisible to leadership.
- The latency problem: Reporting runs a day behind, so today’s losses are discussed tomorrow, after the chance to intervene has passed.
- Manual bottlenecks: Clipboards and spreadsheets add human error and make data stale before it reaches a dashboard.
The shift required is from isolated automation to “Connected Intelligence”.
What are the 4 pillars for reclaiming hidden capacity?
ATS Global uses a proven 4-layer model — The Edge, The Engine, The Enterprise and The Outcome — to move data from machine to boardroom and turn raw signals into decisions.
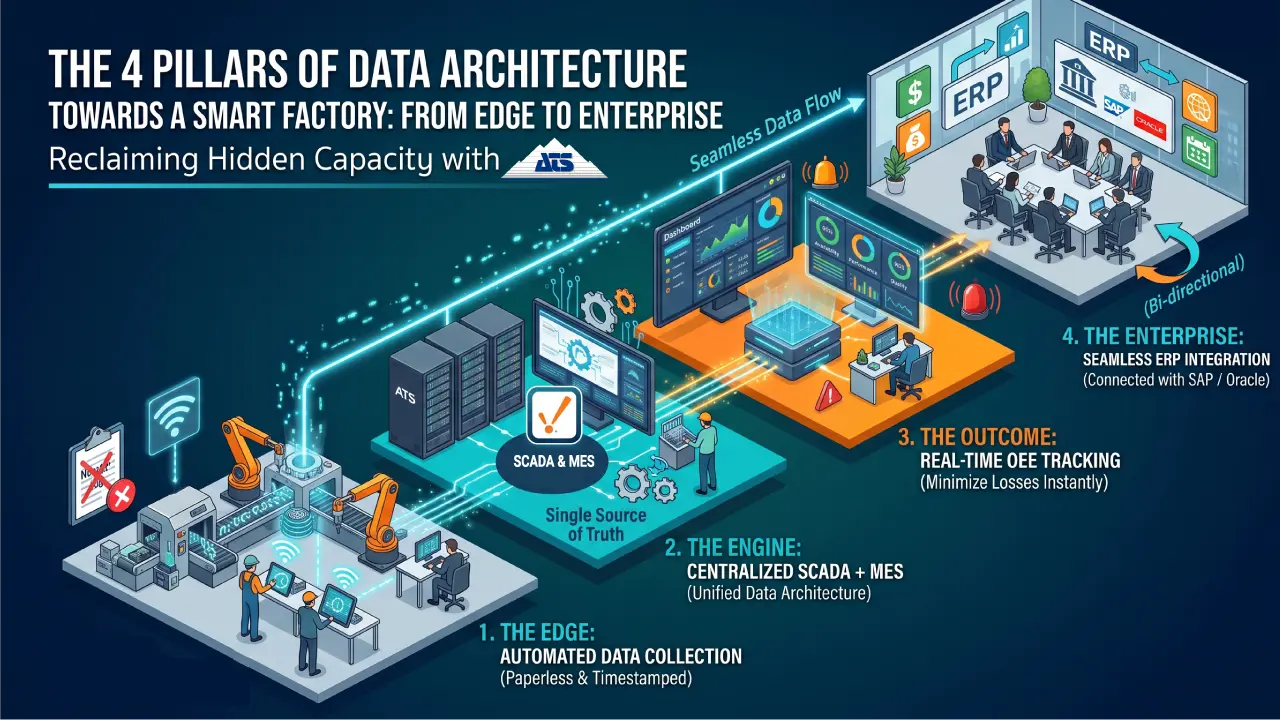
The 4 pillars for reclaiming hidden capacity
| Pillar | Layer | What it does | Business result |
|---|---|---|---|
| 1. Unified SCADA + MES | The Engine | Uses Ignition by Inductive Automation to bridge machinery and business systems in one data architecture. | Eliminates silos; one source of truth. |
| 2. Real-time OEE & tracking | The Outcome | Gives continuous visibility into Availability, Performance and Quality. | Teams act in the moment, before minor issues become shift-ending losses. |
| 3. Automated data collection | The Edge | Replaces paper logs with structured, timestamped digital records at the source. | Data integrity and no report-reconciliation labour. |
| 4. Seamless ERP integration | The Enterprise | Creates a closed loop with SAP, Oracle or other planning systems via bidirectional sync. | Production actuals drive scheduling, procurement and financial reporting in real time. |
What changes day to day: operators see losses as they happen, supervisors respond to trends within the same shift, and plant managers get a standardized, trusted view across all lines.
What ROI can you expect from reclaiming hidden capacity?
The return varies from one organisation to the next, so there is no single percentage that applies to every plant. Each company measures ROI differently. Some count recovered output and revenue, others focus on reduced reporting labour, fewer quality escapes or lower rework cost, and starting points differ by line, shift and site. The best way to size the opportunity for your own operation is to baseline your current OEE and reporting effort, then agree with your team which measures matter most.
Frequently Asked Questions
Next step to start success
Find your hidden capacity. Talk to ATS Global Thailand’s Smart Manufacturing team about a visibility assessment for your plant.