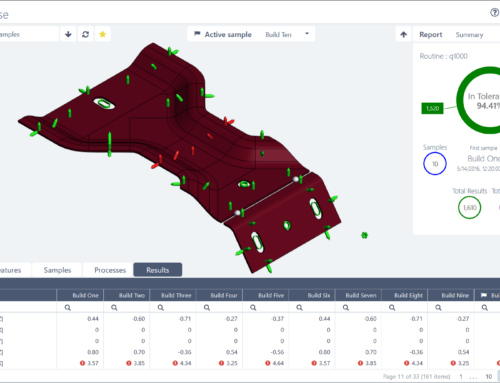
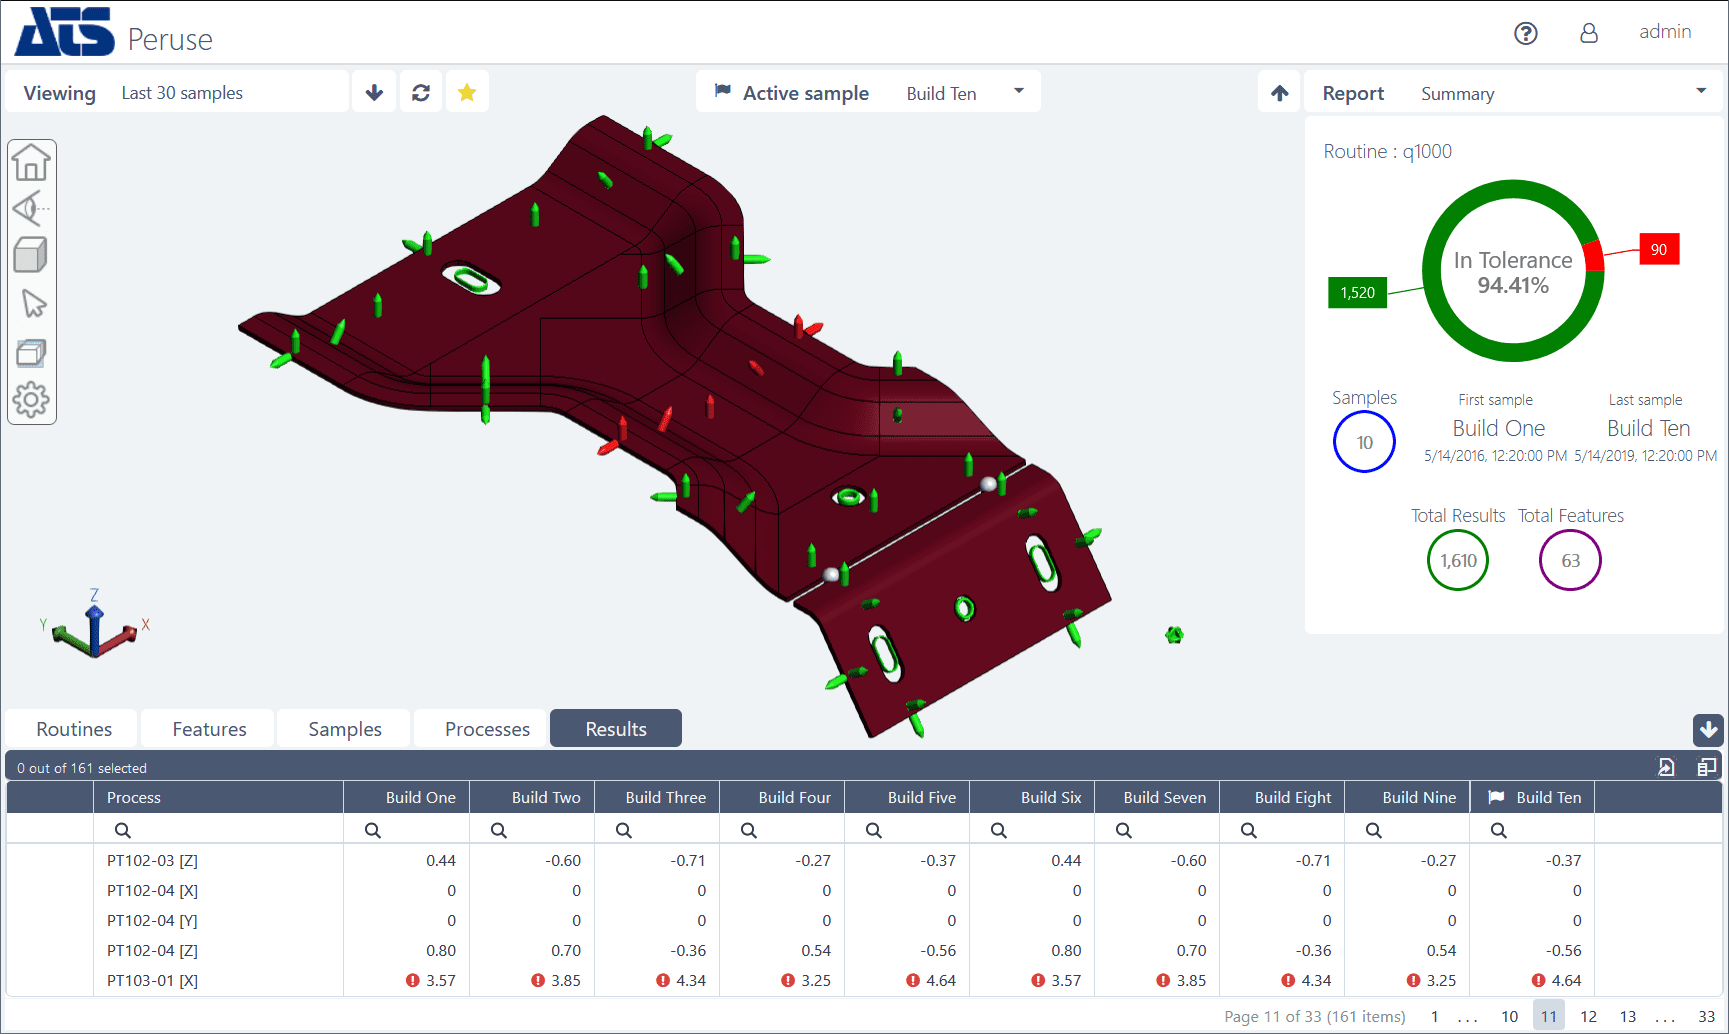
This Template is set up to show constructed features such as distance between points or centre of two points.Otherwise it is very similar to Bar Style Master Points. Each graph shows a trend as a series of coloured bars. The proximity to limits is shown by the bar colour:
- Yellow – 70% of tolerance
- Pale red – outside tolerance
- Dark red – outside double tolerance
 |
.png "Bar Style master Functions") |
Download Example of Bar Style master Functions Report as PDF.
The graph contains a number of key statistical values including Mean, Standard Deviation, Number of valid samples, Range and Cpk/Cp. The mean and Cpk/Cp are set to change colour to quickly highlight features that have bad process capability. The second page is a set to automatically find the worst 10 features on any part considering Cpk and show them clearly in relationship to the CAD model. The third page is a table showing the condition of the last sample. The other page contains summary information, there is a split of all errors in data in 0.5mm steps, an all up analysis of the last 10 parts to show percentage out of tolerance, and a pareto of the worst 10 features showing the number of out of tolerance events for each feature.
To get this CM4D template please register here: https://portal.ats-cm4d.com/
Please contact us if you wish to try ATS CM4D in your plant.


